Visual link charts
People, vehicles, addresses, phones, companies and events on one infinite canvas — the same layout your team sees in briefings and handovers.
Network analysis · police & investigation
Product screenshots · investigation canvas
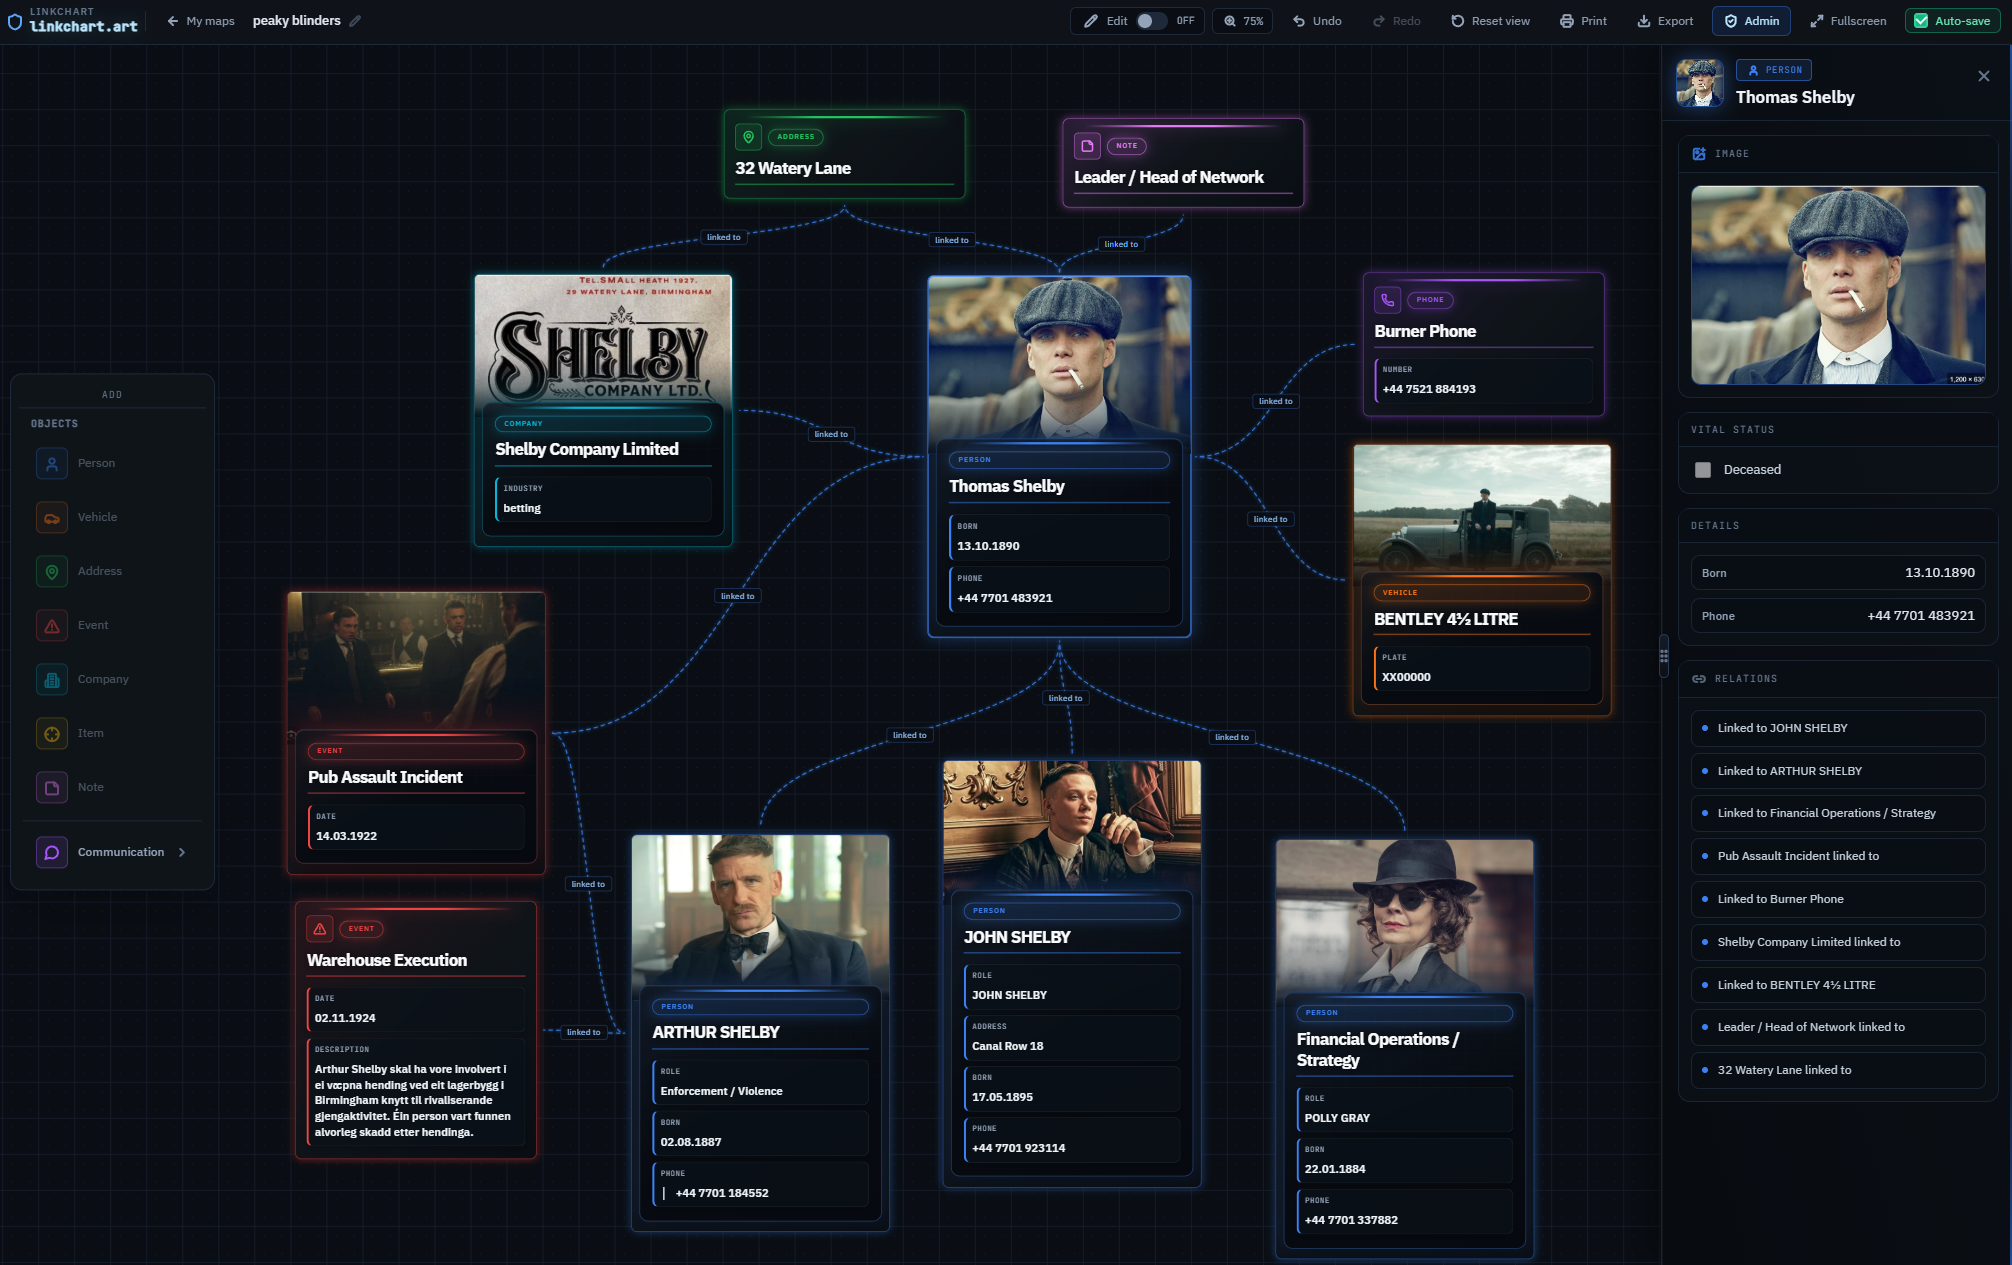
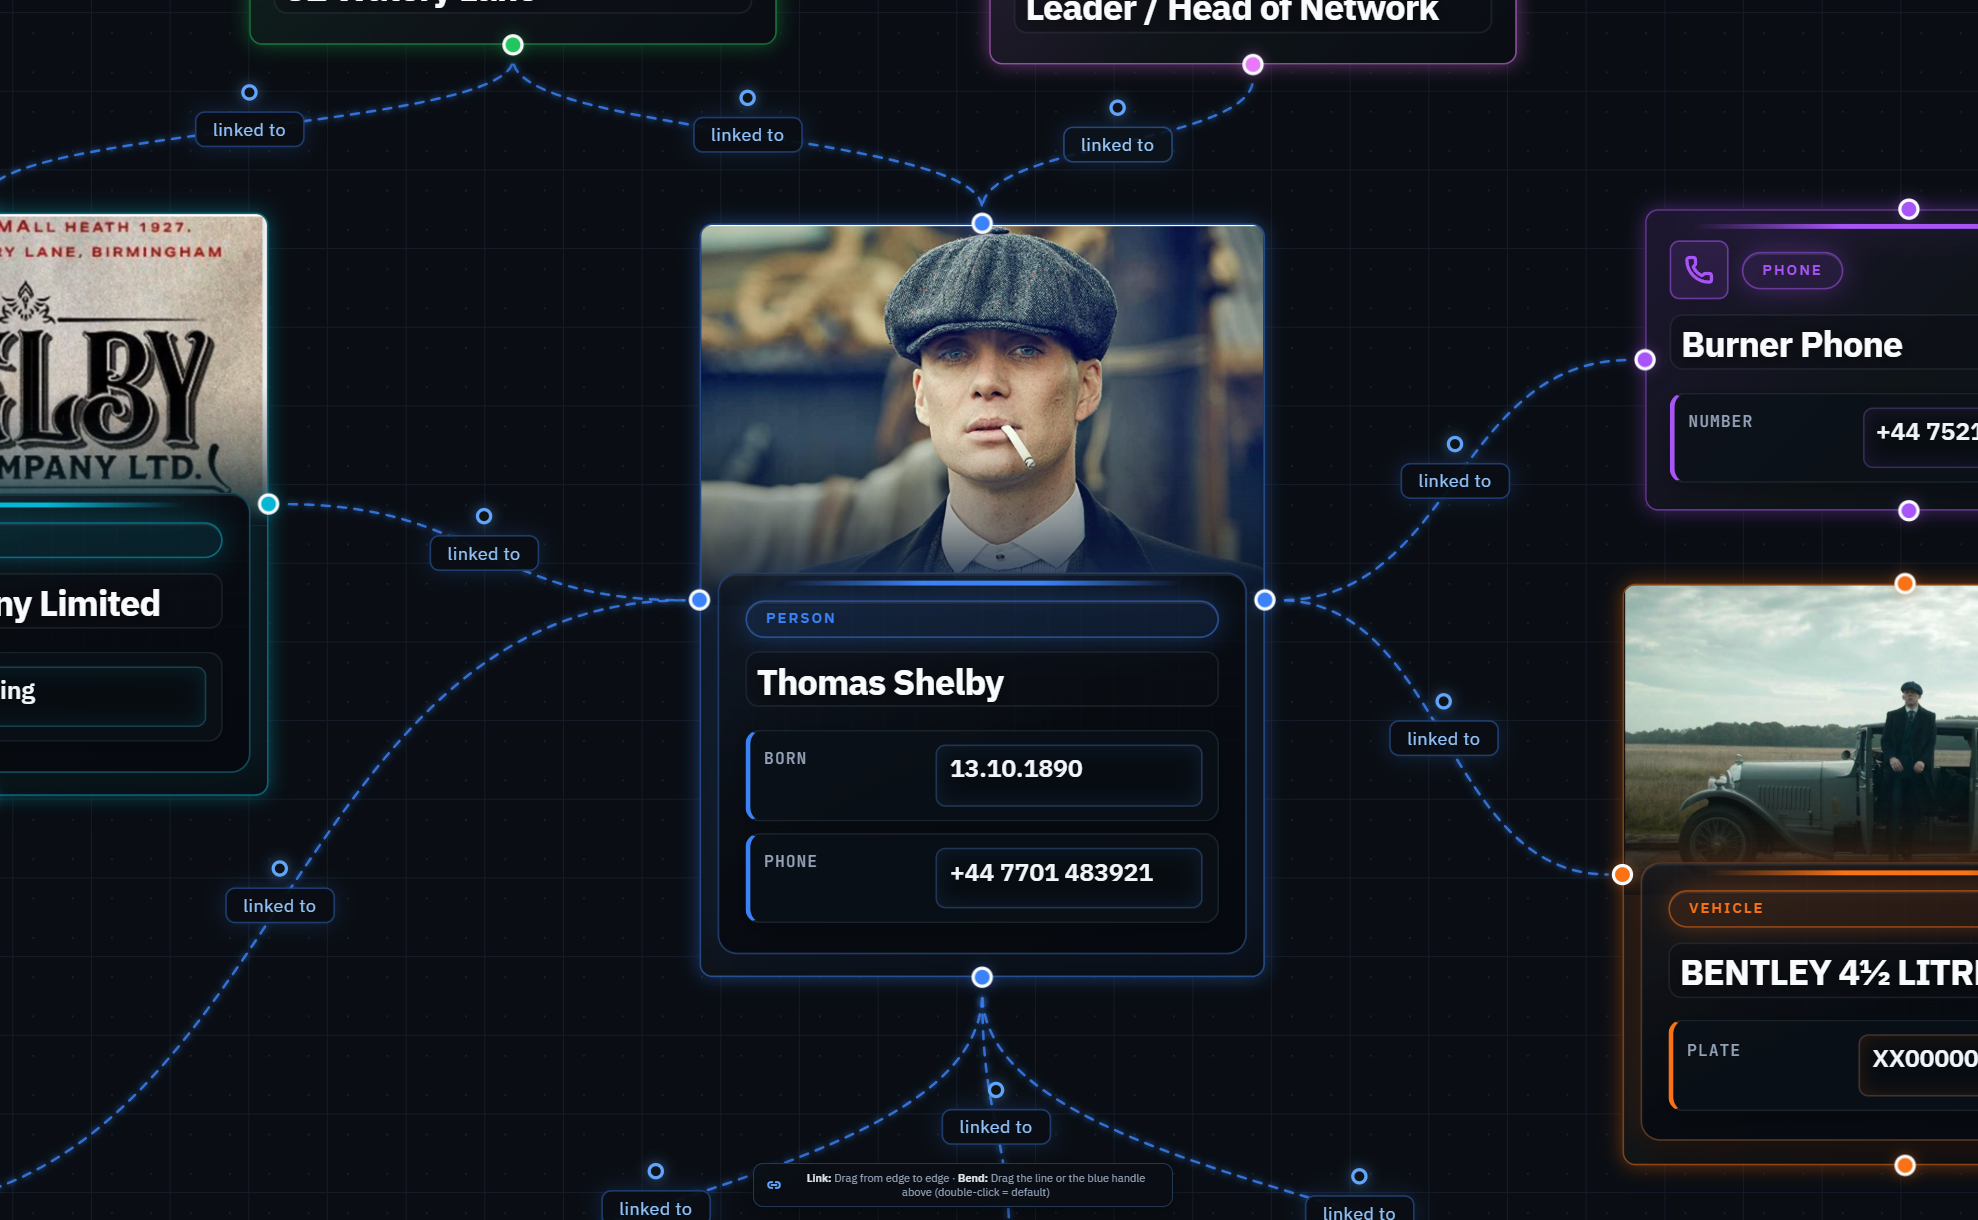
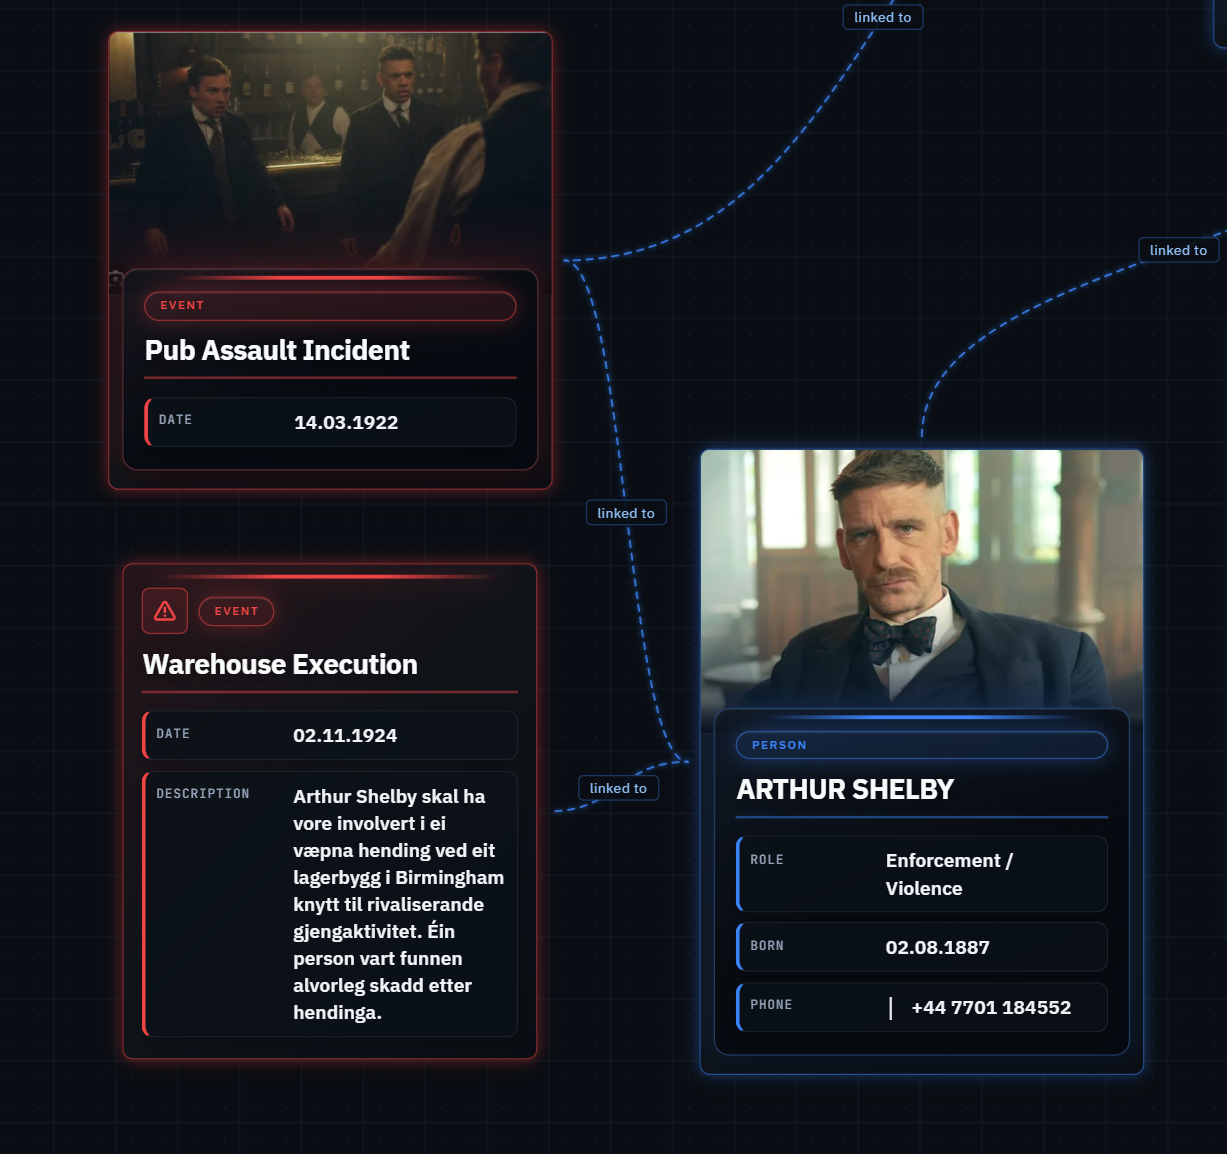
These screenshots show how linkchart maps people, vehicles, addresses, phones, companies and events on one connected investigation canvas, with photo cards, relationship lines and a live details panel.
Investigation software · link analysis
LinkChart is a browser-based platform for relationship mapping and network analysis — typed entity cards, labelled links, collaboration and print-ready exports. No install: sign in at linkchart.art and open your first map in minutes.
People, vehicles, addresses, phones, companies and events on one infinite canvas — the same layout your team sees in briefings and handovers.
Each card has fields, notes and images. Relationship lines carry meaning — not anonymous arrows lost in a slide deck.
Invite editors or viewers per map. Realtime sync keeps distributed analysts aligned on what is confirmed and what still needs checking.
Start with email lookup, username search and phone lookup, then move findings onto your investigation board.
Same cards, toolbar, and connection labels as on the canvas — drag to pan, scroll to zoom, and hover to highlight links.
Drag to pan · scroll to zoom · hover cards
Most investigations start with a single clue — an email, a handle or a phone number. LinkChart connects OSINT-style lookups with visual link analysis so results do not die in browser tabs.
Use free tools for email, username or phone — structured results you can review and verify.
Open profile links, compare overlaps and note what is confirmed vs. still a lead.
Add entities to an investigation board, draw labelled relationships and document sources.
Share the map with your team, print for briefings, and revisit as the case develops.
People, addresses, vehicles and communication — linked with live relationship lines.
Create unlimited maps — sign in and continue where you left off.
Draw lines between cards, group objects and fill in details in the side panel.
Register in under a minute — then create your first blank map.
linkchart helps investigation teams turn scattered facts into a clear, defensible link chart — a digital network map where every person, vehicle, address, phone number, company, event and communication profile is a structured card, and every connection is a labelled line with meaning. The product runs in your browser at linkchart.art; no installation required.
A link chart (association diagram or entity-relationship map) shows how people and objects in a case are connected. Instead of redrawing PowerPoint slides after each development, investigators maintain one living canvas that grows with the inquiry — from the first witness to charging decisions and court briefings.
Law enforcement and detectives map suspects, victims, associates, safe houses and vehicles. Crime analysts merge registry data, open sources and operational reporting. Fraud and insurance investigators trace companies and intermediaries. OSINT researchers document usernames, platforms and shared infrastructure. GTA RP / FiveM crews also build collaborative character relationship maps for gangs, families and long-running server stories.
Sign in, create a map, and add cards from the toolbar. Draw lines between entities and label them — owns, seen at, uses, employed by or your unit’s own taxonomy. Click a card to open the side panel for fields, notes and images. Zoom across large networks, group related cards, and print when you need a physical briefing pack.
Investigation quality improves when each fact sits on the right card type. linkchart provides colour-coded entities so a room full of analysts reads the map at a glance: person cards for subjects and witnesses, vehicle cards with plate and colour fields, address cards for locations, phone cards with number and carrier, event cards for incidents in time, company cards for corporate structures, and dedicated types for social and messaging profiles where digital identity matters. Note cards capture hypotheses, intelligence gaps or supervisor tasking without forcing them into a person node.
Relationship lines are not anonymous arrows. Each link carries a label that explains the claimed connection — essential when a prosecutor, partner agency or shift handover must understand the chart without a long verbal briefing. Hover a card and its network highlights, the same behaviour you can try in the homepage demo.
A typical inquiry starts with a seed entity — a victim, primary suspect or company — and expands as material arrives. Early charts are messy; that is expected. The value is that every new fact has a proposed place in the network, and contradictions become visible. Teams use linkchart in briefings on a large screen, then one analyst cleans layout, merges duplicates and adds fields required for the next operational step. Maps save to your account with auto-save, so long-running cases survive between shifts and weeks apart.
Investigations are rarely solo. linkchart lets you invite collaborators to a specific map with editor or viewer roles. Editors add cards and lines; viewers see the network without changing it — useful for supervisors and partner agencies under need-to-know rules. Sharing happens through accounts on linkchart.art rather than emailing unsecured diagram files that quickly go out of date.
Maps often contain personal data and sensitive operational detail. linkchart uses HTTPS (TLS) for encrypted transport and session-based authentication after sign-in. Access is controlled per map; only owners and invited users see your charts. Your organisation remains responsible for lawful processing, retention and classification under GDPR and local rules — linkchart is the analytical layer; your policies govern when a map may be created and who may view it. Use strong passwords, lock workstations, and treat printouts like any other sensitive exhibit.
Whiteboards are fast for brainstorming but do not scale across months or remote teams. Spreadsheets store facts but hide network shape. Presentation software makes pretty pictures but lacks a data model behind each shape. linkchart is purpose-built for criminal intelligence link analysis: typed entities, labelled links, printing, collaboration and a low barrier to entry with free registration in the browser.
No. linkchart focuses on the visual network view. It complements formal case systems, evidence stores and disclosure workflows — it does not replace them.
Yes. The canvas adapts to phones and tablets for review and light edits; complex layout work is easiest on desktop.
Read the full product guide (~3000 words), our about page, the blog, or create a free account and open your first map.