Most investigations do not become difficult because there is too little information.
They become difficult because there is too much of it.
A person appears in one report. A phone number appears somewhere else. A vehicle is connected to two addresses. A company shares a director with another company. A username leads to several public profiles.
Individually, these details are easy to understand. Once an investigation grows, however, remembering how everything connects becomes much harder.
That is exactly what a link chart is designed to solve.
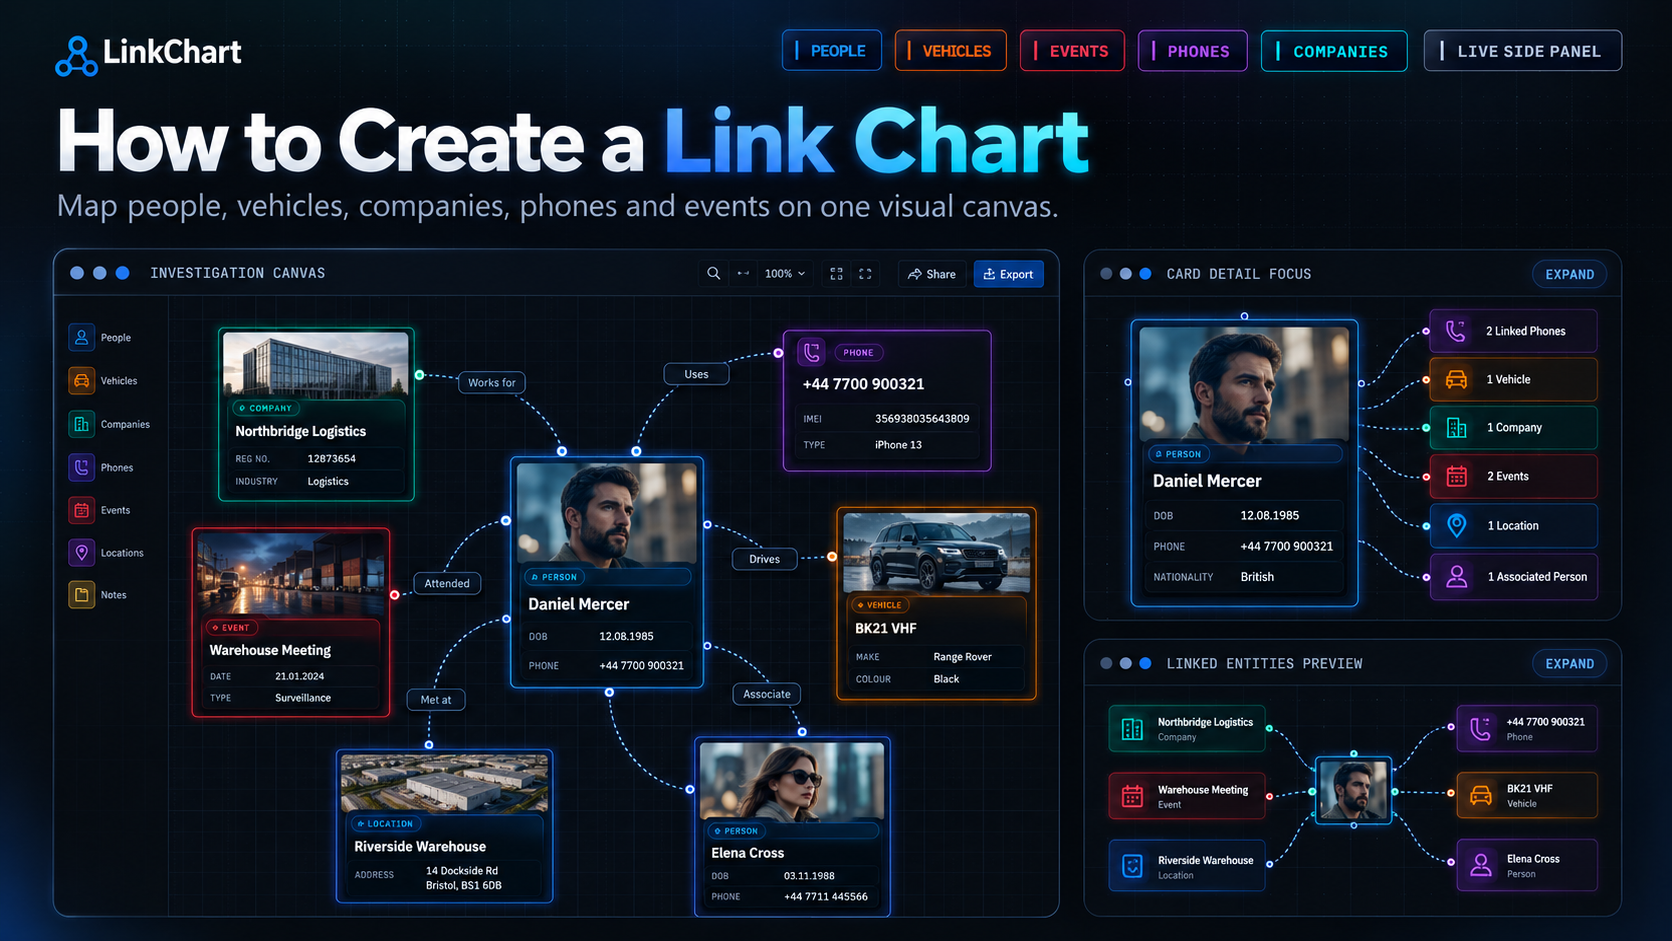
A link chart turns people, places, vehicles, companies, phone numbers, accounts and events into visual entities and connects them with labelled relationships. Instead of trying to remember a network, you can actually see it.
In this guide, you will learn how to create a link chart step by step, how investigators structure them, what information belongs on the chart, and how to keep a growing network readable.
Want to build one while following this guide?
Create a free LinkChart canvas →
What Is a Link Chart?
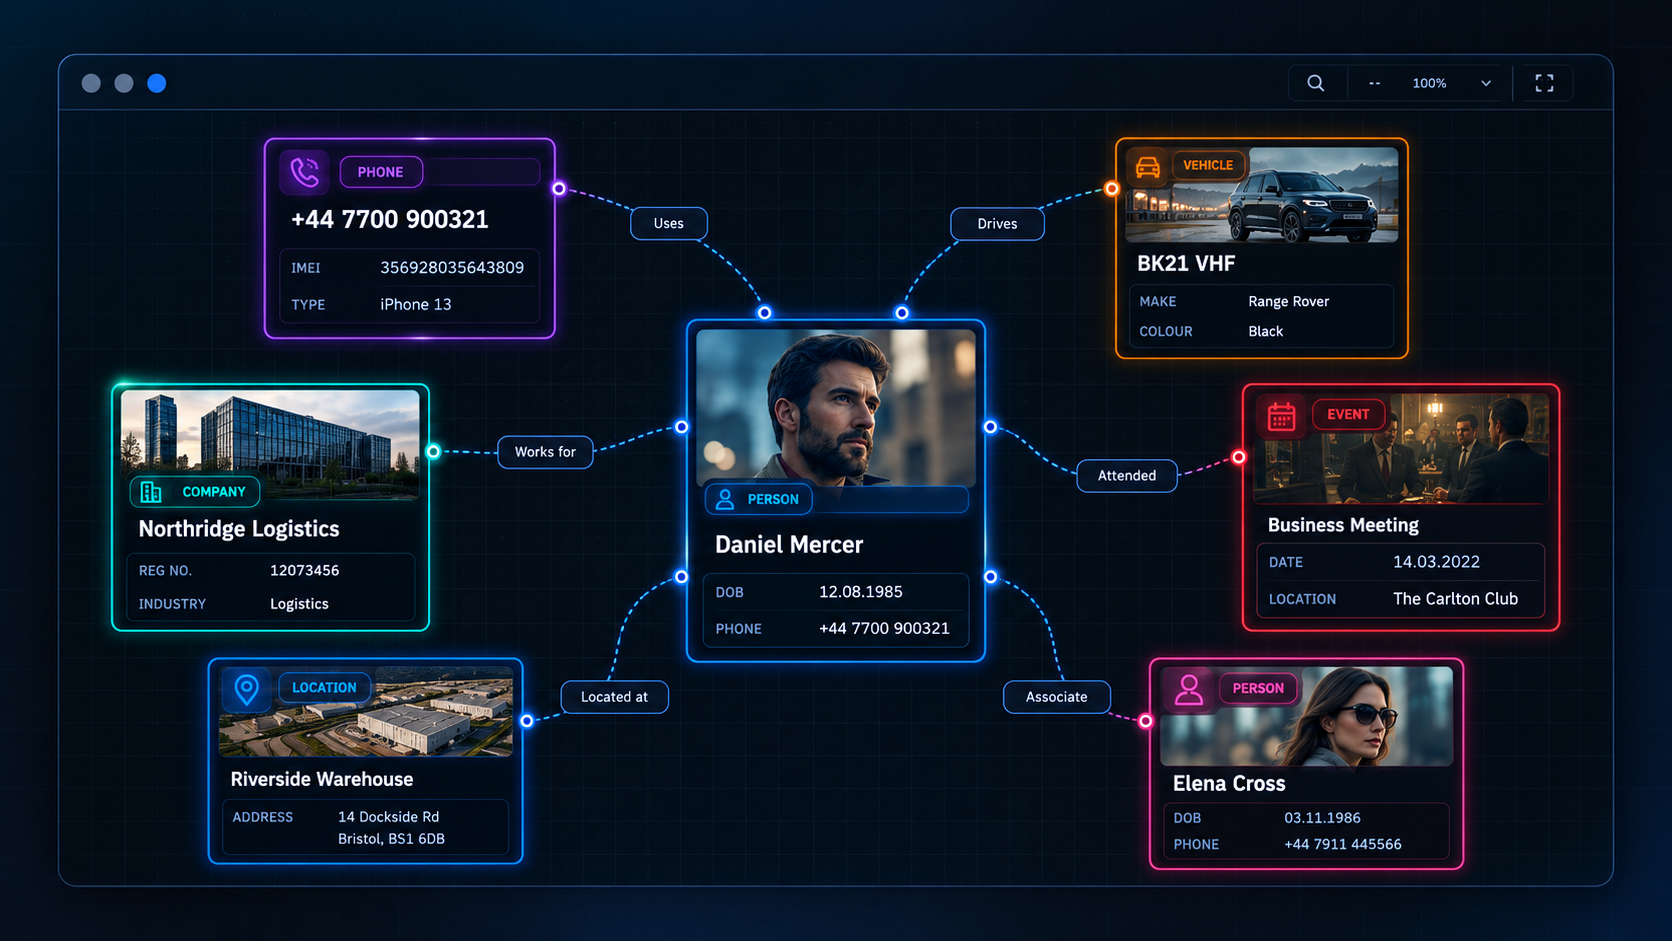
A link chart is a visual representation of relationships between different entities.
An entity can be almost anything relevant to an investigation:
- Person
- Vehicle
- Address
- Phone number
- Company
- Email address
- Username
- Social media profile
- Event
- Document
- Item
- Location
The entities become nodes on the chart.
The relationships between them become links.
For example:
John Smith → owns → BMW X5
BMW X5 → seen at → 14 King Street
John Smith → uses → +47 000 00 000
Phone → communicated with → Person B
Once these relationships are displayed visually, information that was previously scattered across reports, spreadsheets, notes and browser tabs becomes one connected network.
What Is a Link Chart Used For?
Link charts are particularly useful when the important part of the information is not simply what you know, but how different pieces of information relate to each other.
They are commonly useful in:
- Criminal investigations
- Intelligence analysis
- OSINT investigations
- Fraud investigations
- Financial crime analysis
- Corporate investigations
- Due diligence
- Insurance investigations
- Cyber investigations
- Investigative journalism
- Missing-person investigations
A spreadsheet might tell you that five people used five different phone numbers.
A link chart can immediately show that three of those people communicate with the same number, two use the same address, and one vehicle connects both groups.
That difference is what makes visual link analysis so useful.
How to Create a Link Chart: Step by Step
1. Start With the Question You Are Trying to Answer
Do not begin by adding every piece of information you possess.
Start with a question.
For example:
- Who is connected to this person?
- Who controls this company?
- Which people are connected to this address?
- Which accounts appear to belong to the same online identity?
- How are the subjects in these incidents connected?
- Which entity connects two otherwise separate groups?
A clear question gives the chart a purpose.
Without one, an investigation map can quickly turn into a large collection of nodes that looks impressive but does not actually help you understand anything.
2. Choose Your First Entity
Most useful link charts begin with one known entity.
This is your seed entity.
It could be:
- A suspect
- A victim
- A company
- A telephone number
- An email address
- A vehicle
- A username
- A cryptocurrency wallet
- An address
- An incident
Place that entity on the canvas first.
Do not worry about building the entire network immediately. The chart should expand naturally as new information becomes relevant.
In LinkChart, you can create a new map and add your first entity directly to the investigation canvas.
3. Add Related Entities
Next, add the things directly connected to your starting point.
Imagine the investigation starts with one person.
You may know their:
- Home address
- Vehicle
- Phone number
- Employer
- Company
- Social media account
- Known associate
Each of those should normally become its own entity rather than being buried inside one large note.
This matters because the same entity may later connect somewhere else.
An address that initially appears to belong to one person may later appear in a company registration. A phone number may communicate with another subject. A vehicle may appear at several events.
Once those objects exist independently on the chart, those connections become visible.
4. Label Every Important Relationship
This is one of the most important rules in link charting:
A line should explain something.
A line between two objects without a label forces the viewer to guess why they are connected.
Instead of this:
Person A — Person B
use something meaningful:
Person A → sibling of → Person B
or:
Person A → called → Person B
Useful relationship labels might include:
- Owns
- Lives at
- Registered at
- Director of
- Works for
- Uses
- Called
- Messaged
- Transferred money to
- Seen with
- Seen at
- Attended
- Related to
- Purchased from
The relationship is often more important than the entity itself.
LinkChart therefore uses labelled relationship lines rather than forcing every connection to be an anonymous arrow.
Open a free canvas and try creating your first relationship →
5. Add Context to the Entities
A professional investigation chart should not consist only of names floating around a canvas.
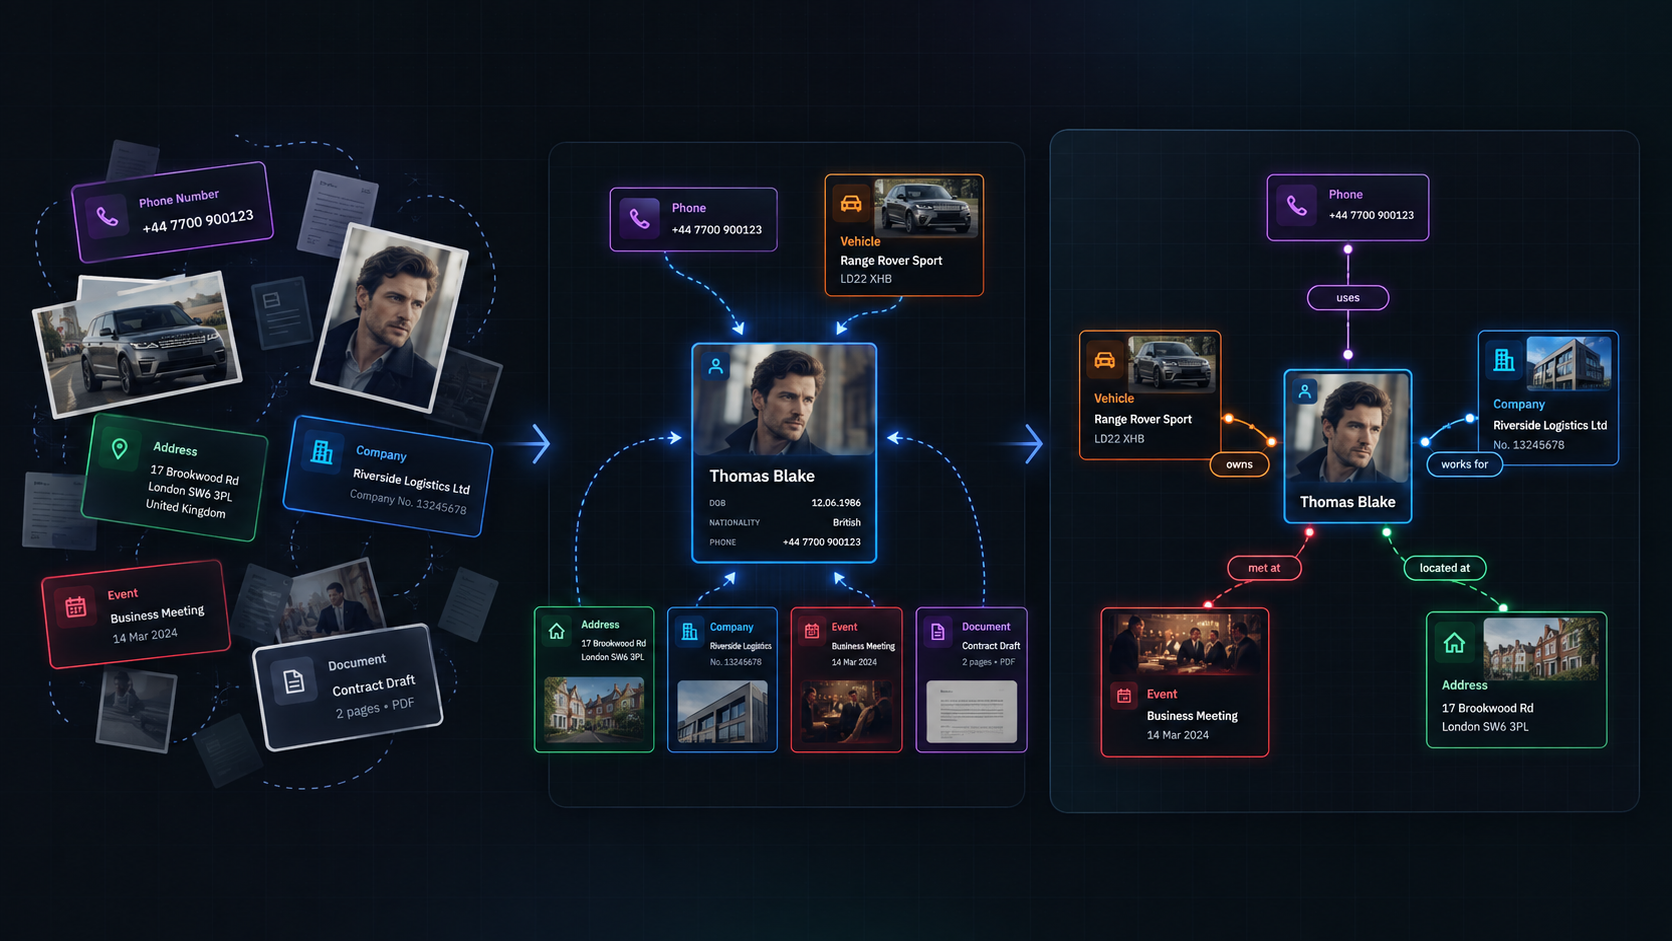
Each entity should contain enough context to remain understandable later.
A vehicle might include:
- Registration number
- Make and model
- Colour
- Relevant notes
- Image
A person could contain:
- Name
- Role
- Relevant identifiers
- Notes
- Photo
A phone entity might include the number, carrier information and notes about where the number originated.
This is one reason purpose-built link chart software is useful. A generic diagram tool gives you boxes. Investigation software can give those boxes meaning.
6. Expand the Network One Connection at a Time
Once the first layer is mapped, start expanding.
For every entity, ask:
What does this connect to?
Suppose a company is connected to your original subject.
The company might lead to:
- Another director
- A registered address
- A telephone number
- A website
- A second company
The second director might then connect to another company.
That company may use the same address as another entity already on your chart.
This is where the value of the network begins to increase.
You are no longer reading isolated facts.
You are exploring a structure.
A Simple Investigation Link Chart Example
Imagine an investigator starts with one person:
Person A
The investigation reveals:
Person A owns Vehicle 1.
Person A uses Phone 1.
Person A is director of Company A.
Company A is registered at Address 1.
Another person, Person B, also uses Address 1.
Phone 1 has communicated repeatedly with Phone 2.
Phone 2 belongs to Person B.
Written as individual facts, that information is understandable.
But the structure becomes much clearer when mapped:
Person A → Company A → Address 1 ← Person B
and simultaneously:
Person A → Phone 1 → Phone 2 ← Person B
There are now two independent pathways connecting Person A and Person B.
That does not automatically prove anything about the nature of their relationship. But it gives the investigator something specific to examine and verify.
How to Keep a Large Link Chart Readable
The biggest mistake beginners make is assuming that more nodes automatically create a better chart.
They do not.
A chart containing 500 entities can be less useful than one containing 30 carefully selected entities.
As the investigation grows, use structure deliberately.
Group Related Entities
Keep entities that belong to the same household, organisation, event or investigative cluster reasonably close together.
This creates visible groups without needing to study every line individually.
Keep Relationship Labels Short
Use:
owns
instead of:
is believed to be the registered owner of
The detailed explanation can remain in the entity notes or your source material.
Avoid Duplicate Entities
If the same phone number appears in five different sources, it should usually still be one phone entity connected to five relevant entities.
Duplicates fragment your network and can hide the importance of a central node.
Do Not Map Irrelevant Information
Ask whether a new node helps answer the investigative question.
If it does not, consider leaving it outside the primary chart or documenting it elsewhere.
Let the Layout Show Structure
Do not arrange everything into a perfect grid simply because it looks tidy.
The physical layout can communicate meaning.
Clusters can represent groups. Central nodes can show highly connected entities. Separate sections can distinguish companies, communication data, events or different investigative hypotheses.
Link Chart vs Spreadsheet
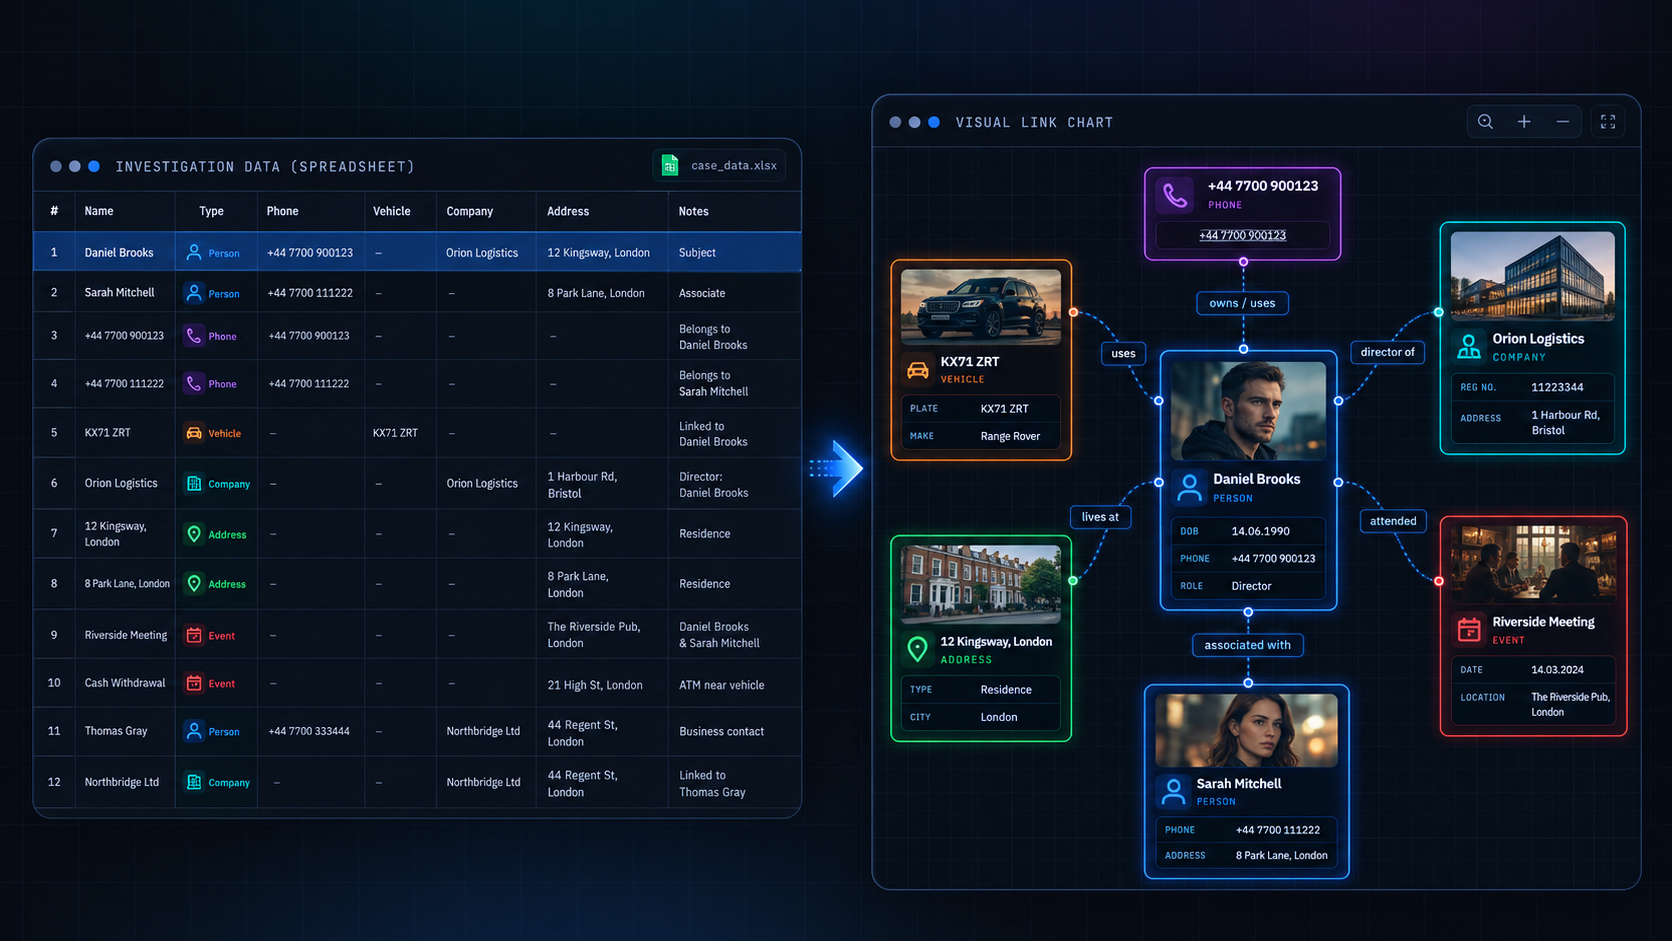
Spreadsheets are excellent for storing structured information.
They are much less effective at showing complex many-to-many relationships.
Consider a spreadsheet containing:
Person A — Phone 1
Person B — Phone 2
Person C — Phone 3
Person A — Address 1
Person C — Address 1
Phone 1 — Phone 3
The connections exist inside the data.
But the reader has to reconstruct the network mentally.
A link chart does the opposite.
It turns those relationships into the primary interface.
This does not mean investigators should abandon spreadsheets. The two formats solve different problems.
Spreadsheets store rows. Link charts show relationships.
Link Chart vs Mind Map
A mind map normally starts with one central concept and branches outward hierarchically.
A link chart is different.
Investigation networks rarely behave like clean trees.
One person may connect to several phones, companies and addresses. Those companies may connect to other people. Those people may connect back to the original network.
The result is a many-to-many network, not a simple hierarchy.
That is why a purpose-built link chart maker is usually better suited to investigation work than ordinary mind-mapping software.
Link Chart vs Flowchart
A flowchart normally describes a process:
Step A → Step B → Step C.
A link chart describes relationships:
Person → Vehicle → Address ← Company ← Person.
If you are trying to understand what happens next, you may need a flowchart.
If you are trying to understand what is connected to what, you probably need a link chart.
Using Link Charts for OSINT Investigations
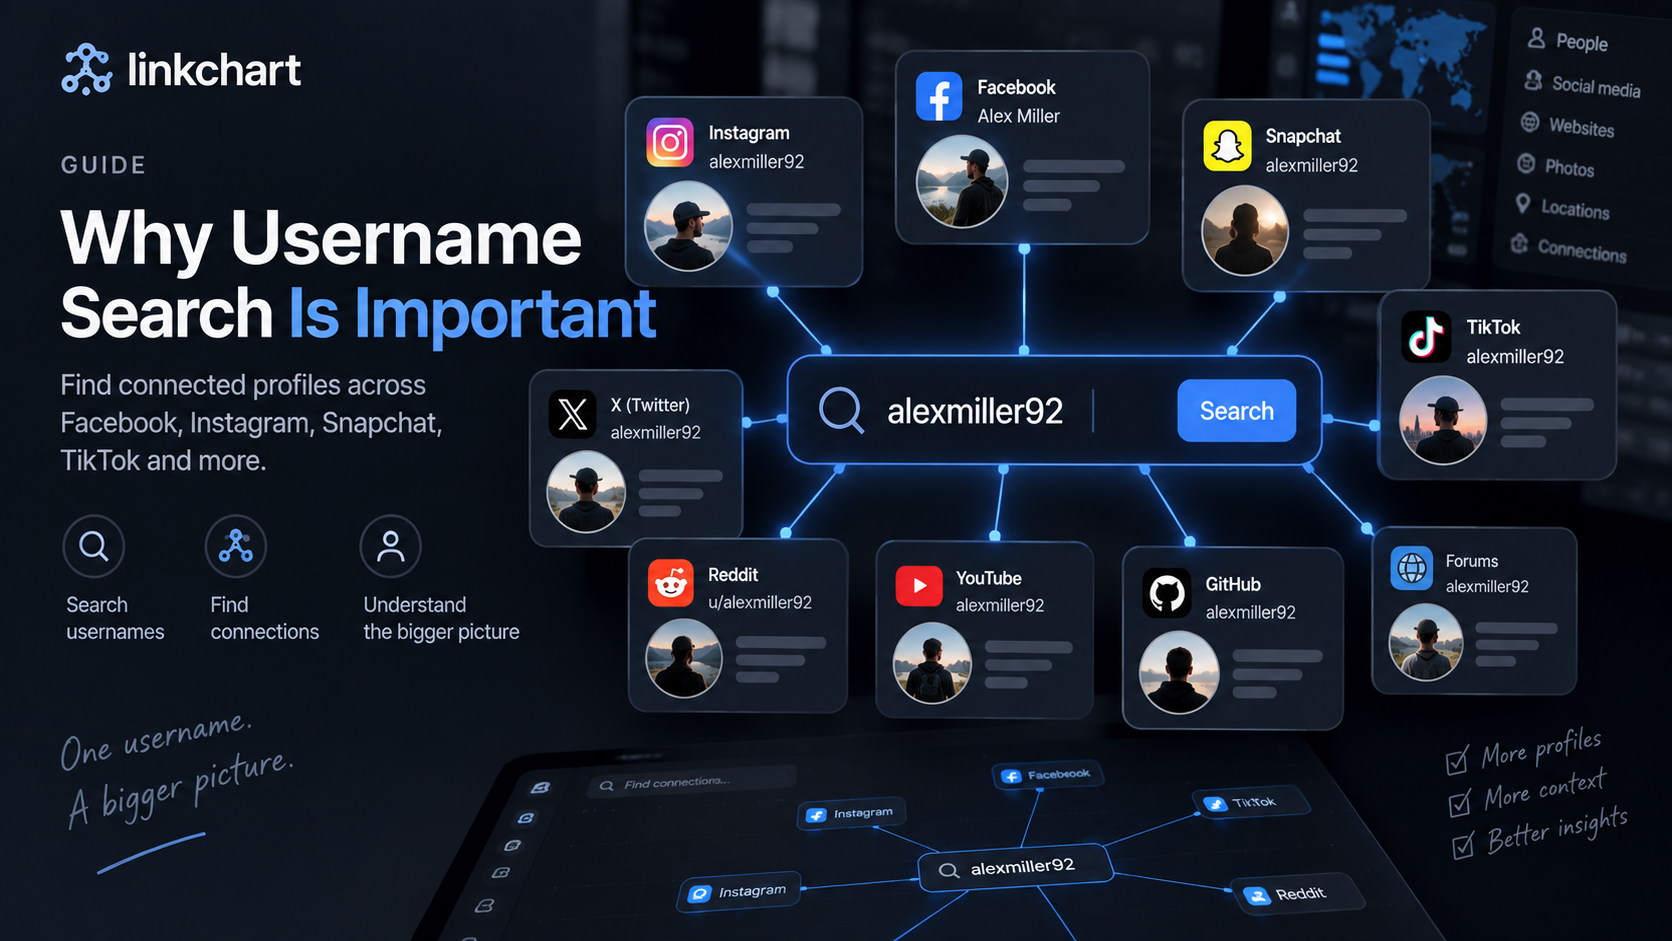
Link charts can become particularly useful in open-source intelligence (OSINT) because online investigations often produce large numbers of small identifiers.
You might begin with a username and discover:
- A Reddit account
- A forum profile
- A social media account
- An email address
- Another username
- A website
- A company
Each result can then create additional research paths.
Without structure, the investigation often ends up spread across dozens of browser tabs.
A better workflow is:
Search → Verify → Map → Expand
LinkChart also provides email, username and phone lookup tools that can be used as starting points before confirmed or relevant information is placed onto an investigation canvas.
Look for Bridges, Clusters and Repeated Entities
Once your link chart has grown beyond the first few entities, stop adding information for a moment and study the network.
Some of the most useful observations are often structural.
Bridges
A bridge is an entity connecting two parts of the network that otherwise appear separate.
It could be a person, address, telephone number, company or vehicle.
Clusters
A cluster is a group of entities with many internal connections.
A cluster might represent a household, business network, group of associates or collection of related online identities.
Highly Connected Entities
An entity connected to unusually many other entities deserves attention.
That does not automatically make it important to the investigation, but it can justify closer examination.
Repeated Addresses, Numbers or Accounts
Repeated identifiers are easy to overlook when information is stored across different documents.
On a visual map, repetition becomes much harder to miss.
Do Not Confuse a Connection With a Conclusion
A link chart helps you identify relationships.
It does not automatically explain those relationships.
Two people connected to the same address could be family members, former tenants, employees, customers or entirely unrelated people whose records happen to overlap.
An investigator should therefore keep a clear distinction between:
- Verified information
- Reported information
- Analytical hypotheses
- Unverified leads
The purpose of the chart is to make reasoning easier to inspect — not to turn every visual connection into a conclusion.
Why Use Dedicated Link Chart Software?
You can technically build a link chart using paper, PowerPoint, a whiteboard or generic diagram software.
For very small networks, that may be enough.
The problems usually appear when the investigation changes.
A new person appears.
A vehicle changes ownership.
Another phone number is discovered.
An existing assumption turns out to be wrong.
A second investigator needs access.
A briefing requires a cleaner version of the network.
Static diagrams then need to be moved, redrawn and redistributed.
A dedicated investigation canvas allows the network to remain a living piece of work.
Build Your Link Chart Online With LinkChart
LinkChart is built specifically around visual investigation and link analysis.
Instead of starting with generic rectangles and arrows, you can create structured entities for information such as:
- People
- Vehicles
- Addresses
- Phone numbers
- Companies
- Events
- Items
- Digital profiles
- Notes
Every entity sits on an infinite investigation canvas.
You can draw relationships between entities, label those relationships, move groups around the canvas, add notes and images, and continue expanding the network as the investigation develops.
Your maps are saved to your account, so you can return to an investigation instead of rebuilding the chart each time.
Maps can also be shared with collaborators when multiple people need to work from the same network view.
When the chart needs to leave the screen, it can be prepared for printing or reporting.
No desktop installation is required.
Create your free LinkChart account and open your first canvas →
A Good First Link Chart Takes Less Than You Think
You do not need hundreds of entities to get value from link analysis.
Start with five.
For example:
- Add your primary person.
- Add their phone.
- Add their vehicle.
- Add an address.
- Add one known associate.
Then connect them using precise relationship labels.
You now have a functioning investigation link chart.
From there, allow the investigation — rather than the software — to determine where the network expands next.
Frequently Asked Questions About Link Charts
What is a link chart?
A link chart is a visual network showing entities such as people, companies, vehicles, addresses, phones and events together with the relationships between them.
How do you create a link chart?
Start with one important entity, add directly related entities, connect them using clearly labelled relationships and continue expanding the network as new verified information becomes relevant.
What is an investigation link chart?
An investigation link chart is a relationship map designed to help investigators understand how subjects, locations, assets, communications, organisations and events connect within a case.
What is another name for a link chart?
Depending on the context, similar visualisations may be called association charts, relationship maps, entity-relationship diagrams, network diagrams or link analysis charts.
What should be included in a link chart?
Include entities and relationships that help answer the question behind the investigation. Typical entities include people, addresses, companies, phone numbers, vehicles, accounts, events and locations.
Is a link chart the same as a mind map?
No. Mind maps are usually hierarchical. Link charts are designed for many-to-many relationships where one entity can connect to multiple parts of a network.
Can you create a link chart online?
Yes. Browser-based tools such as LinkChart allow you to build and save investigation link charts online without installing desktop software.
Can I create a link chart for free?
Yes. Standard registration and map creation on LinkChart are available without charge, so you can create an account and start building an investigation canvas directly in your browser.
Can link charts be used for OSINT?
Yes. OSINT investigators can use link charts to connect usernames, email addresses, domains, social profiles, companies, phone numbers and other publicly discovered information into one visual network.
Turn Scattered Information Into a Network
An investigation can contain hundreds or thousands of individual facts.
The difficult part is often understanding how those facts interact.
A link chart gives those relationships somewhere to exist.
Start with one entity.
Add what it connects to.
Label the relationship.
Then follow the network.
What begins as five cards can gradually become a visual model of an entire investigation — while still allowing you to move from the full network down to a single person, phone, vehicle or event.
If you already have a case, research project or OSINT investigation in mind, you can start building it now.
Create a free investigation canvas with LinkChart →
Or learn more about how LinkChart works and explore our guide to relationship mapping.