Relationship Mapping: The Complete Guide to Visualizing Complex Connections
Every investigation starts with one question.
How are these people connected?
Sometimes the answer is obvious.
Most of the time it isn't.
A phone number appears in two cases.
A vehicle belongs to multiple people.
Two companies share the same address.
A social media profile appears in several investigations.
Individually, these facts don't tell much of a story.
Together, they can reveal an entire network.
This is exactly what relationship mapping is designed to do.
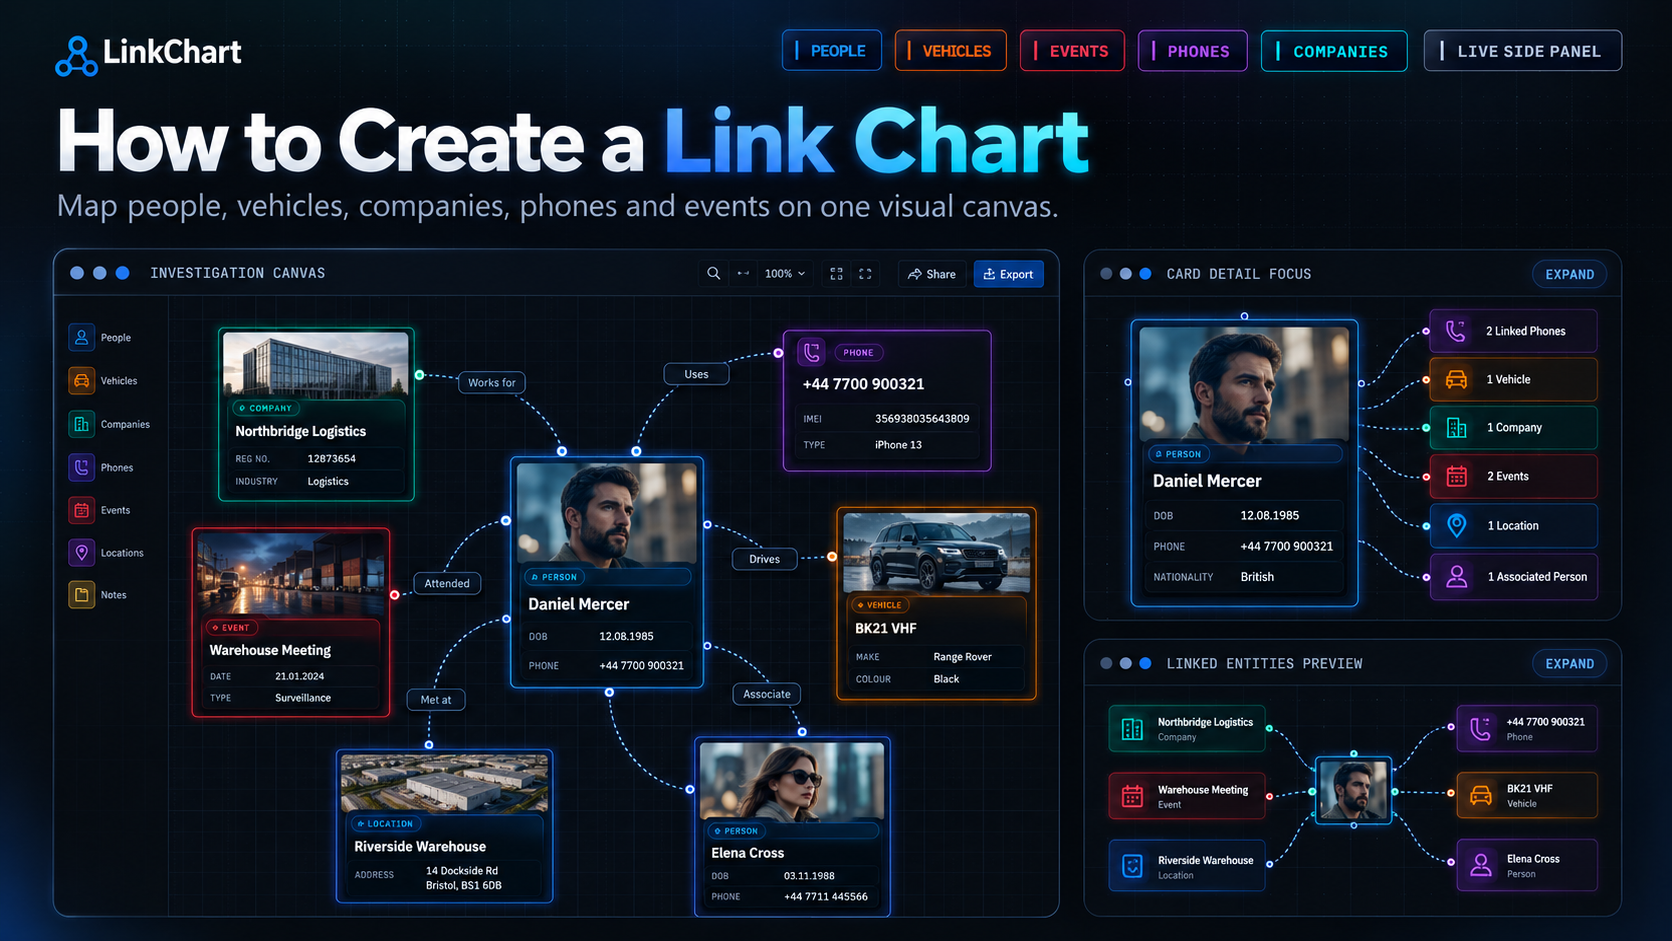
Instead of looking at hundreds of notes, spreadsheets or documents, relationship mapping transforms information into a visual network where people, places, companies, vehicles and events become connected in a way that's easy to understand.
Whether you're conducting an investigation, performing OSINT research, managing business relationships or organizing complex information, relationship mapping allows patterns to appear that would otherwise remain hidden.
What You'll Learn
- What relationship mapping is
- Why visual mapping works better than spreadsheets
- Who uses relationship mapping
- Different types of relationship maps
- Best practices
- Common mistakes
- The best relationship mapping software available today
What Is Relationship Mapping?
Relationship mapping is the process of visually displaying how different entities are connected.
These entities can include:
- People
- Companies
- Locations
- Vehicles
- Phone numbers
- Email addresses
- Social media accounts
- Financial transactions
- Events
- Documents
Instead of reading connections from text, a relationship map displays them as a visual graph.
Each object becomes a node.
Each connection becomes a relationship.
As the network grows, patterns become much easier to understand.
Why Humans Understand Visual Networks Better
The human brain is remarkably good at recognizing visual patterns.
It's much easier to notice that one person is connected to five companies than to discover the same fact buried inside an Excel spreadsheet.
Visual relationship mapping reduces cognitive load.
Instead of remembering hundreds of individual facts, your brain immediately starts recognizing:
- Clusters
- Bridges
- Isolated nodes
- Central people
- Hidden relationships
- Unusual activity
This is why investigators have used relationship charts for decades.
Modern software simply makes the process dramatically faster.
Relationship Mapping vs Link Analysis
Many people use these terms interchangeably.
While closely related, they describe slightly different processes.
Relationship Mapping focuses on visualizing connections between entities.
Link Analysis goes one step further by analysing those relationships to discover hidden structures, influence, patterns and behaviour.
Think of relationship mapping as creating the map.
Link analysis is interpreting what the map actually means.
Modern software usually combines both.
Where Relationship Mapping Is Used
Criminal Investigations
Detectives use relationship mapping to connect:
- Suspects
- Witnesses
- Vehicles
- Addresses
- Communication records
- Financial transactions
Visualizing relationships often reveals patterns impossible to notice inside reports.
Open Source Intelligence (OSINT)
OSINT analysts connect:
- Usernames
- Domains
- Companies
- Leaked information
- Social media profiles
- Email addresses
A relationship graph quickly shows which identities belong together.
Business Intelligence
Companies use relationship mapping to understand:
- Customers
- Suppliers
- Competitors
- Partnerships
- Ownership structures
Fraud Detection
Banks and insurance companies frequently use relationship mapping to identify:
- Organized fraud
- Synthetic identities
- Repeated claims
- Suspicious transactions
- Shell companies
Connections that appear harmless individually often become suspicious once visualized.
Journalism
Investigative journalists often build relationship maps while researching:
- Corruption
- Political influence
- Offshore companies
- Financial networks
- Public records
A visual map allows months of research to remain organized throughout an investigation.
Why Spreadsheets Eventually Fail
Spreadsheets are excellent.
Until they aren't.
Once information grows beyond a few hundred rows, relationships become increasingly difficult to follow.
Questions like:
- Who introduced this person?
- Which phone belongs to this company?
- How many cases include this vehicle?
- Which address appears most frequently?
Relationship mapping removes this friction.
The network becomes the interface.
Instead of searching for relationships...
You simply see them.
How to Build an Effective Relationship Map
A relationship map is only as useful as the information it contains.
Professional relationship maps are built with purpose.
Every node has a reason for existing.
Every connection answers a specific question.
Before adding anything, ask yourself:
- Does this help explain the investigation?
- Does this create a meaningful connection?
- Will this information still matter later?
Start With the Central Entity
Every relationship map should begin with one central point.
This could be:
- A person
- A company
- A vehicle
- A phone number
- A cryptocurrency wallet
- An email address
- A location
- An event
Everything else grows naturally from there.
Choose Clear Entity Types
Separate different kinds of information.
- People
- Companies
- Locations
- Vehicles
- Communication
- Events
Using consistent entity types makes large investigations much easier to understand.
Relationships Matter More Than Nodes
Many beginners spend time adding hundreds of entities.
Professionals focus on the connections.
Instead of simply linking two people, describe how they're connected.
Examples include:
- Owns
- Lives at
- Works for
- Called
- Messaged
- Met with
- Purchased from
- Attended
Add Evidence to Every Connection
Every relationship should contain supporting evidence whenever possible.
- Police report
- Interview
- Public record
- Financial document
- Phone extraction
- Social media profile
- CCTV footage
- Witness statement
Keep the Map Readable
Large investigations can easily grow into hundreds or thousands of nodes.
Good relationship maps remain readable by:
- Grouping related entities
- Using consistent layouts
- Avoiding unnecessary crossing lines
- Hiding irrelevant information
- Using colors carefully
- Keeping labels short
Common Relationship Mapping Mistakes
Adding Everything
Not every piece of information deserves a node.
Missing Context
A line between two people means very little without explaining how they're connected.
Duplicate Entities
One person should exist once.
Poor Naming
Use descriptive names that remain understandable as the investigation grows.
Why Visual Thinking Changes Everything
Imagine trying to understand a network of 250 people using only a spreadsheet.
Now imagine seeing every connection visually.
Clusters appear.
Key individuals become obvious.
Hidden bridges emerge.
Outliers stand out.
That's the power of relationship mapping.
Relationship Mapping Software
Modern relationship mapping software allows you to:
- Create unlimited nodes
- Connect entities instantly
- Organize investigations
- Collaborate with teammates
- Attach notes and evidence
- Filter large networks
- Export charts
- Update investigations continuously
Why LinkChart Was Built
Many relationship mapping tools are overly complicated, expensive or designed only for enterprise customers.
LinkChart was built to make relationship mapping intuitive without sacrificing power.
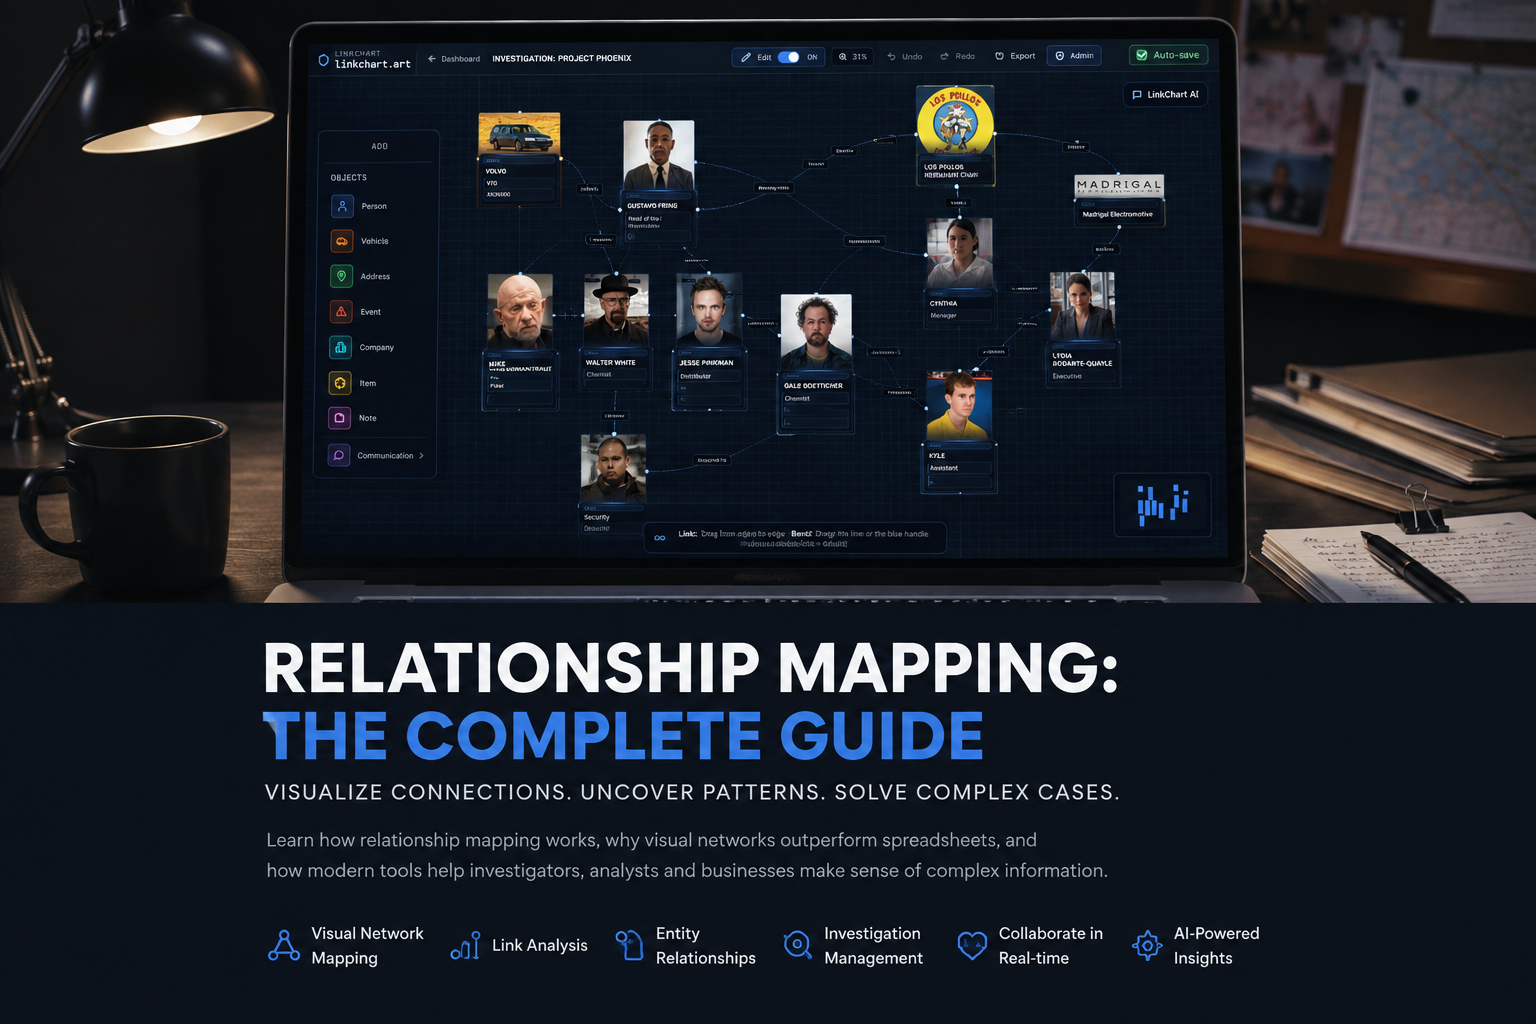
Instead of forcing users into rigid workflows, LinkChart provides an infinite canvas where investigations can grow naturally.
You can connect:
- People
- Companies
- Locations
- Vehicles
- Events
- Communication
- Documents
Whether you're conducting OSINT research, organizing investigative notes or mapping complex business relationships, LinkChart helps you visualize information that spreadsheets simply can't.
The Future of Relationship Mapping
Artificial intelligence is transforming relationship mapping.
Modern AI can help:
- Suggest missing relationships
- Identify duplicate entities
- Detect unusual patterns
- Summarize investigations
- Recommend new research directions
AI isn't replacing investigators.
It's helping them discover more.
Frequently Asked Questions
What is relationship mapping?
Relationship mapping is the process of visually displaying how people, companies, locations and other entities are connected.
What is the difference between relationship mapping and link analysis?
Relationship mapping creates the visual graph, while link analysis interprets that graph to uncover patterns and hidden relationships.
Who uses relationship mapping?
Investigators, OSINT researchers, journalists, fraud analysts, businesses and intelligence professionals all rely on relationship mapping.
Why is relationship mapping better than spreadsheets?
Visual networks allow humans to recognize patterns, clusters and hidden relationships significantly faster than spreadsheets.
Can relationship mapping be used outside investigations?
Yes. Businesses use relationship mapping for customer relationships, ownership structures, partnerships, compliance and organizational analysis.
Final Thoughts
Information alone rarely solves complex problems.
Connections do.
Relationship mapping transforms disconnected facts into visual intelligence, making it easier to understand how people, organizations and events interact.
If you're looking for an intuitive platform to build professional relationship maps, organize investigations and collaborate with your team, LinkChart gives you everything you need on one infinite canvas.