Picture this: you're deep into a fraud investigation, and your desk is a chaotic sea of notes and unlabeled diagrams. Important relationships between entities are buried somewhere in the clutter, leaving you and your team overwhelmed and uncertain. The anticipation of uncovering a breakthrough is overshadowed by the frustration of missing connections in your data. It's a familiar scene for many OSINT investigators, where the stakes are high and the pressure to deliver clear, actionable insights is relentless. But what if the real challenge isn't just about having the right tools or techniques? What if it's about how we organize and visualize the information we gather?
Most discussions around OSINT focus on the tools and methods, yet they often overlook the transformative power of well-organized data. The clarity and confidence that come from a structured investigation map can mean the difference between a breakthrough and a dead end. This article promises to take you beyond the obvious, exploring innovative visualization techniques and the psychological satisfaction of order. It's about finding joy in a well-structured investigation map, akin to the 'Marie Kondo' effect in digital investigations. Whether you're navigating complex corporate espionage cases or piecing together a political campaign's web of connections, understanding the nuances of OSINT data organization can redefine your investigative outcomes.
The Chaos of Disorganized OSINT
Imagine you're tasked with investigating a political campaign. The data you've collected is scattered across various platforms, each piece of information isolated, with no clear connections. The potential for missing critical links is high, and the pressure mounts as deadlines loom. This disorganization doesn't just slow the process; it can lead to missed opportunities and erroneous conclusions. In such high-stakes environments, clarity is not just a luxury but a necessity.
Consider the frustration of briefing a team with diagrams that lack labels or context. Instead of providing clarity, these visuals add to the confusion, making it difficult to communicate findings effectively. This scenario is all too common in OSINT investigations, where the volume of data can be overwhelming without a structured approach.
The Psychological Satisfaction of Order
There's a profound sense of relief and confidence that comes with a well-organized investigation. When data is neatly structured, it reduces stress and enhances the ability to make informed decisions. This is akin to the 'Marie Kondo' effect in digital investigations, where joy is found in the order and clarity of a well-structured map.
In high-stakes investigations, this psychological satisfaction translates into increased confidence. Knowing that every piece of data is accounted for and easily accessible allows investigators to focus on analysis rather than organization, leading to more robust and reliable conclusions.
Innovative Visualization Techniques
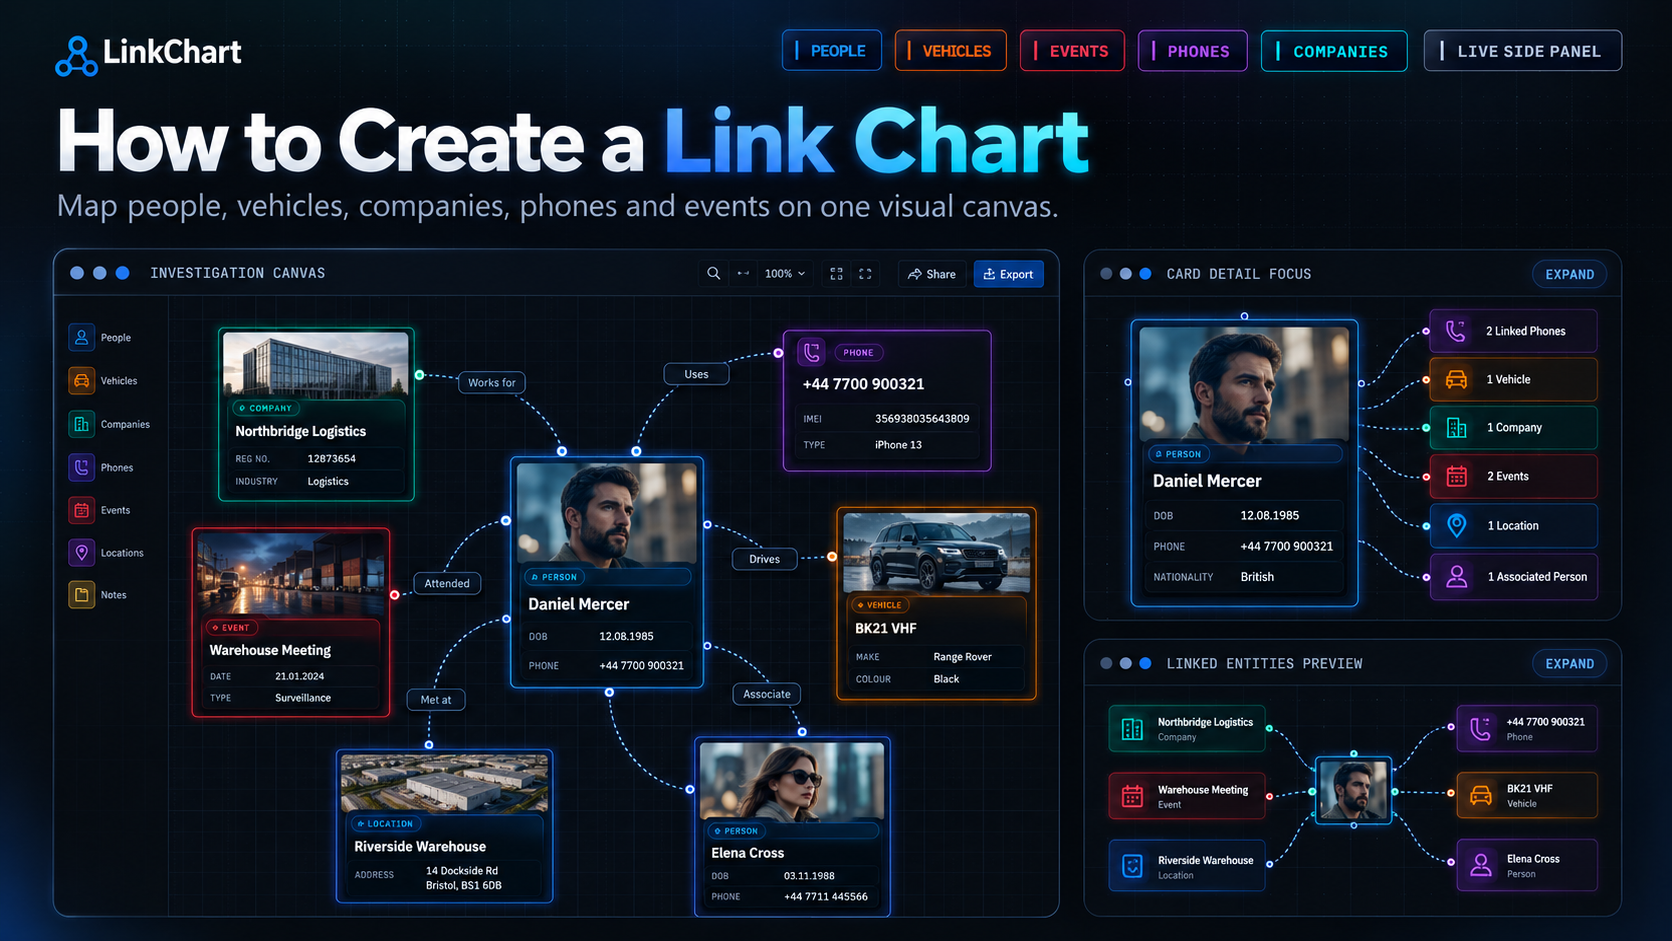
Visualization techniques have evolved, offering new ways to manage and interpret complex data sets. Labeled link charts, for example, provide a clear, visual representation of relationships within dense corporate espionage cases. These charts not only maintain clarity but also facilitate the discovery of hidden narratives within the data.
Visual storytelling through charts enables investigators to see patterns and connections that might otherwise remain obscured. By turning data into a narrative, these techniques help to uncover the stories hidden within the chaos, making it easier to communicate findings effectively.
Avoiding Common Organizational Pitfalls
One of the most significant pitfalls in OSINT data organization is the use of unlabeled edges in complex crime networks. Without clear labels, the meaning of connections is lost, leading to potential misinterpretations. Another common mistake is poor post-investigation data management, which can undermine future cases by leaving data disorganized and inaccessible.
To avoid these pitfalls, it's crucial to adopt methods that emphasize clarity and traceability. Ensuring that all connections are clearly labeled and maintaining an organized archive of past investigations can prevent these issues from arising.
The Role of Cognitive Biases in Data Organization
Cognitive biases, such as confirmation bias, can significantly impact the interpretation of OSINT data. When investigators unconsciously seek out information that confirms their existing beliefs, they risk overlooking critical evidence that contradicts their assumptions. This can skew the results of an investigation, leading to inaccurate conclusions.
To mitigate these biases, structured data visualization techniques can be employed. By presenting data in a clear and unbiased manner, investigators can ensure that all evidence is given equal consideration, reducing the risk of bias influencing the outcome of the investigation.
Comparing Digital vs. Analog Methods
In the fast-paced world of OSINT investigations, analog methods often fall short. The limitations of paper-based systems become apparent as investigations evolve and grow in complexity. Digital methods, on the other hand, offer the flexibility and scalability needed to manage large volumes of data effectively.
Consider a case study where a digital approach was used to map a multi-platform OSINT trail. The ability to quickly update and revise digital charts allowed investigators to adapt to new information as it emerged, maintaining an accurate and comprehensive view of the investigation at all times.
Cultural Influences on OSINT Organization
Cultural differences can significantly affect how data is interpreted and organized. Investigators must be aware of these influences and adapt their strategies accordingly. For instance, certain cultural contexts may prioritize different types of information or interpret relationships in unique ways.
By understanding and respecting these differences, investigators can ensure that their organizational strategies are effective across diverse contexts, leading to more accurate and culturally sensitive investigations.
Case Studies: Successful OSINT Organization
One journalist's journey from chaos to clarity in a cross-border investigation highlights the transformative power of organized OSINT data. By employing labeled link charts, they were able to piece together a complex web of connections, ultimately uncovering a story that might have otherwise remained hidden.
Similarly, a compliance team used link charts to streamline their due diligence processes. By maintaining a clear and organized map of relationships, they were able to quickly identify potential risks and take action, demonstrating the practical benefits of effective OSINT organization.
The Future of OSINT Data Management
Emerging technologies in data visualization hold significant potential for the future of OSINT data management. As these tools continue to evolve, they offer new ways to organize and interpret complex data sets, making investigations more efficient and effective.
The role of AI in organizing and interpreting OSINT data is also set to grow. By automating certain aspects of data management, AI can help to reduce the burden on investigators, allowing them to focus on analysis and decision-making.
FAQ
What are the best tools for organizing OSINT data?
The best tools for organizing OSINT data often include features for visual mapping and labeled relationships. For instance, link charts allow investigators to map out complex networks with clarity, ensuring that each connection is meaningful and traceable. Tools like Maltego and Palantir are popular for their advanced data integration capabilities, while linkchart offers a browser-based solution focused on clarity and investigative confidence.
How can visualization techniques improve OSINT investigations?
Visualization techniques improve OSINT investigations by transforming complex data into clear, actionable insights. For example, using labeled link charts can help investigators quickly identify key relationships and patterns within large datasets, making it easier to track activities and connections. This approach not only enhances understanding but also aids in briefing teams and making informed decisions.
What challenges do OSINT investigators face in data organization?
OSINT investigators often face challenges such as data overload, unstructured information, and the risk of cognitive biases affecting interpretation. Organizing data with clear visual maps and maintaining labeled relationships can mitigate these issues, ensuring that investigations remain focused and accurate. Additionally, integrating digital tools that support collaboration and revisability can help manage these challenges effectively.
How does organized OSINT data affect investigation outcomes?
Organized OSINT data significantly improves investigation outcomes by providing clarity and reducing the risk of missing critical connections. For instance, a well-structured link chart can highlight hidden relationships and streamline the decision-making process, ultimately leading to more accurate and timely conclusions. This organization also facilitates better team collaboration and more effective communication of findings.
What are innovative methods for OSINT data management?
Innovative methods for OSINT data management include using advanced visualization tools that support labeled relationships and dynamic data integration. Techniques such as visual storytelling and the use of AI for pattern recognition are becoming increasingly popular. These methods not only enhance the efficiency of data analysis but also improve the overall clarity and reliability of the investigation process.
Reflecting on the intricate dance of organizing OSINT data, it's clear that the journey from chaos to clarity is not just about the tools you use, but how you use them. There's a certain satisfaction in seeing a complex investigation unfold clearly on a map, where each connection is meaningful and every relationship is labeled. It's like piecing together a puzzle where every piece has a purpose.
For those who have experienced the frustration of unlabeled diagrams and scattered information, the concept of a labeled link chart might resonate deeply. Imagine a scenario where your investigation's narrative is not just a collection of facts, but a coherent story told through visual connections. Some OSINT workflows now keep people, accounts, and organizations on one revisable map instead of scattered tabs, allowing for a shared understanding that can transform how teams collaborate.
One approach that keeps cases readable is a labeled link chart — linkchart is built around that idea. It's not about adding another tool to your arsenal; it's about enhancing your investigative confidence and ensuring that every line you draw has a clear, traceable meaning. Clarity is the point: a chart only helps if you can trust what each line means.